Dashboard
The Dashboard is the central control panel of AutoPubliX. It provides a quick overview of your social media activity, post performance, and automation insights across all connected platforms.
Users can monitor performance, track scheduled content, and review recent activities—all in one place.
Header Section

Greeting Message
Displays a personalized welcome message such as:
- Updates dynamically based on time of day.
- Helps personalize the user experience.
Create New Post Button
Instantly opens the post creation panel.
Users can:
- Create posts
- Upload reels
- Add stories
- Insert products
- Choose publish type (Draft / Schedule / Publish Now)
Setup Completion
Keep track of your dashboard setup progress to ensure all platforms are connected and ready.
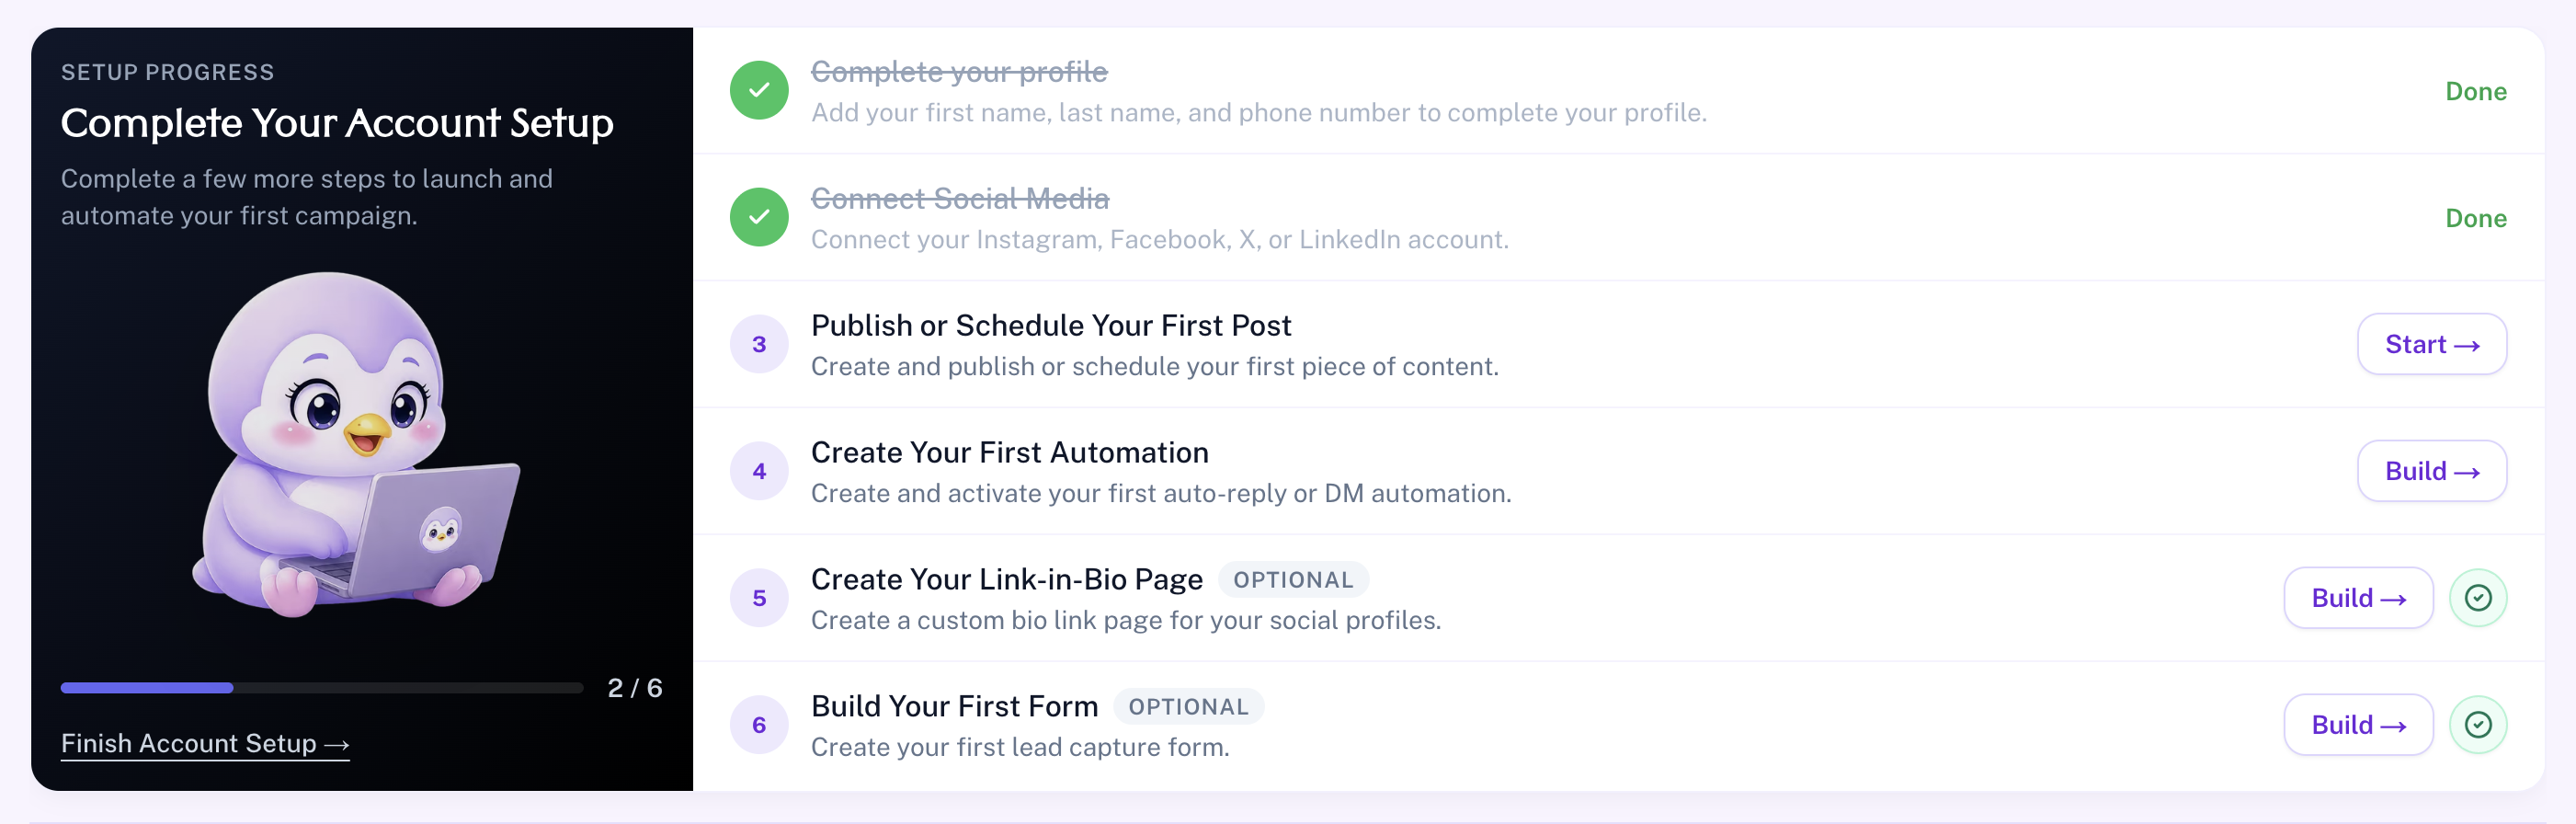
This section helps users:
- Review completed setup steps.
- Identify missing platform connections.
- Ensure the account is fully configured for automation.
Key Metrics Cards
These cards provide a quick snapshot of performance.
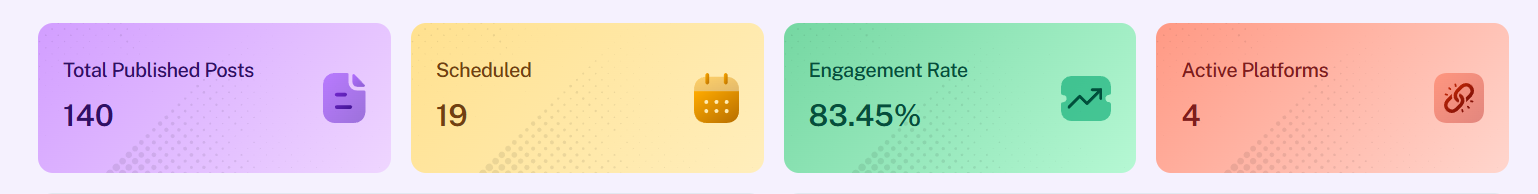
1. Total Published Posts
- Displays the total number of posts published across all platforms.
- Includes posts, reels, and stories.
- Track your overall content output.
2. Scheduled Posts Count
- Shows the number of posts currently scheduled.
- Helps manage upcoming content.
- Ensures consistent posting strategy.
3. Engagement Rate
- Displays overall engagement percentage.
- Includes likes, comments, shares, Interactions, etc.
4. Active Platforms
- Shows how many platforms are currently connected and active.
- Supported platforms: Instagram, Facebook, Twitter, LinkedIn
- Quickly verify connected
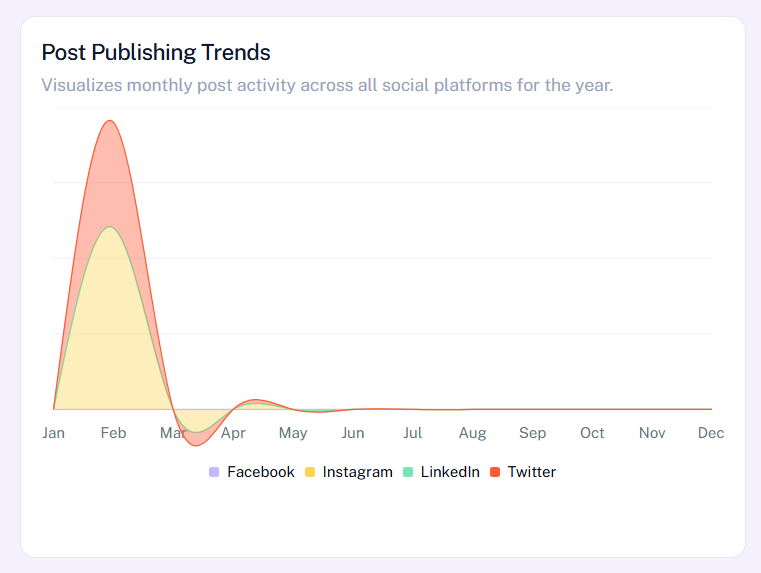
Post Publishing Trends
This section provides a visual overview of your monthly posting activity across all connected platforms, including Instagram, Facebook, LinkedIn, and Twitter. It helps you understand how frequently you are publishing content and whether your posting strategy is consistent throughout the year.
By analyzing these trends, users can identify peak activity periods, compare performance across platforms, and adjust their content planning accordingly. This insight is useful for maintaining a balanced posting schedule and improving overall content reach.
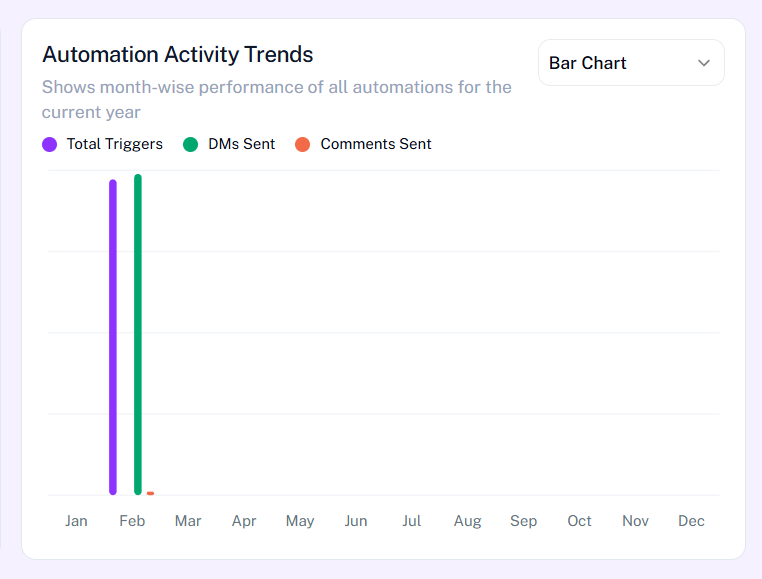
Automation Activity Trends
This section displays the performance of your automation workflows over time using a graphical representation. It includes key metrics such as total triggers, DMs sent, and comments sent, giving a clear picture of how your automation's are functioning.
With this data, users can evaluate the effectiveness of their automation strategies, identify which campaigns are performing well, and make informed decisions to optimize engagement. It also helps in tracking growth driven by automated interactions.
Recent Posts
The Recent Posts section shows a list of your latest published content across all connected platforms. Each entry includes a preview of the post, engagement metrics like likes and comments, and the time it was published.
This section allows users to quickly review their recent activity and monitor how their content is performing. It helps in identifying which types of posts are engaging the audience and supports better content decision-making.
Scheduled Posts
This section displays all posts that are planned for future publishing. It helps users keep track of upcoming content and ensures that their posting schedule remains organized and consistent.
If no posts are scheduled, the section clearly indicates it, prompting users to plan ahead. This feature is essential for maintaining a steady content flow and avoiding gaps in posting.
Recent Activity
The Recent Activity section provides a real-time log of actions happening across your connected platforms. This includes post interactions, automation responses, and other engagement-related activities.
It helps users stay updated on what is happening with their content and automations without needing to check each platform individually. This centralized view improves efficiency and allows for quick monitoring of overall account activity.