Analytics Dashboard
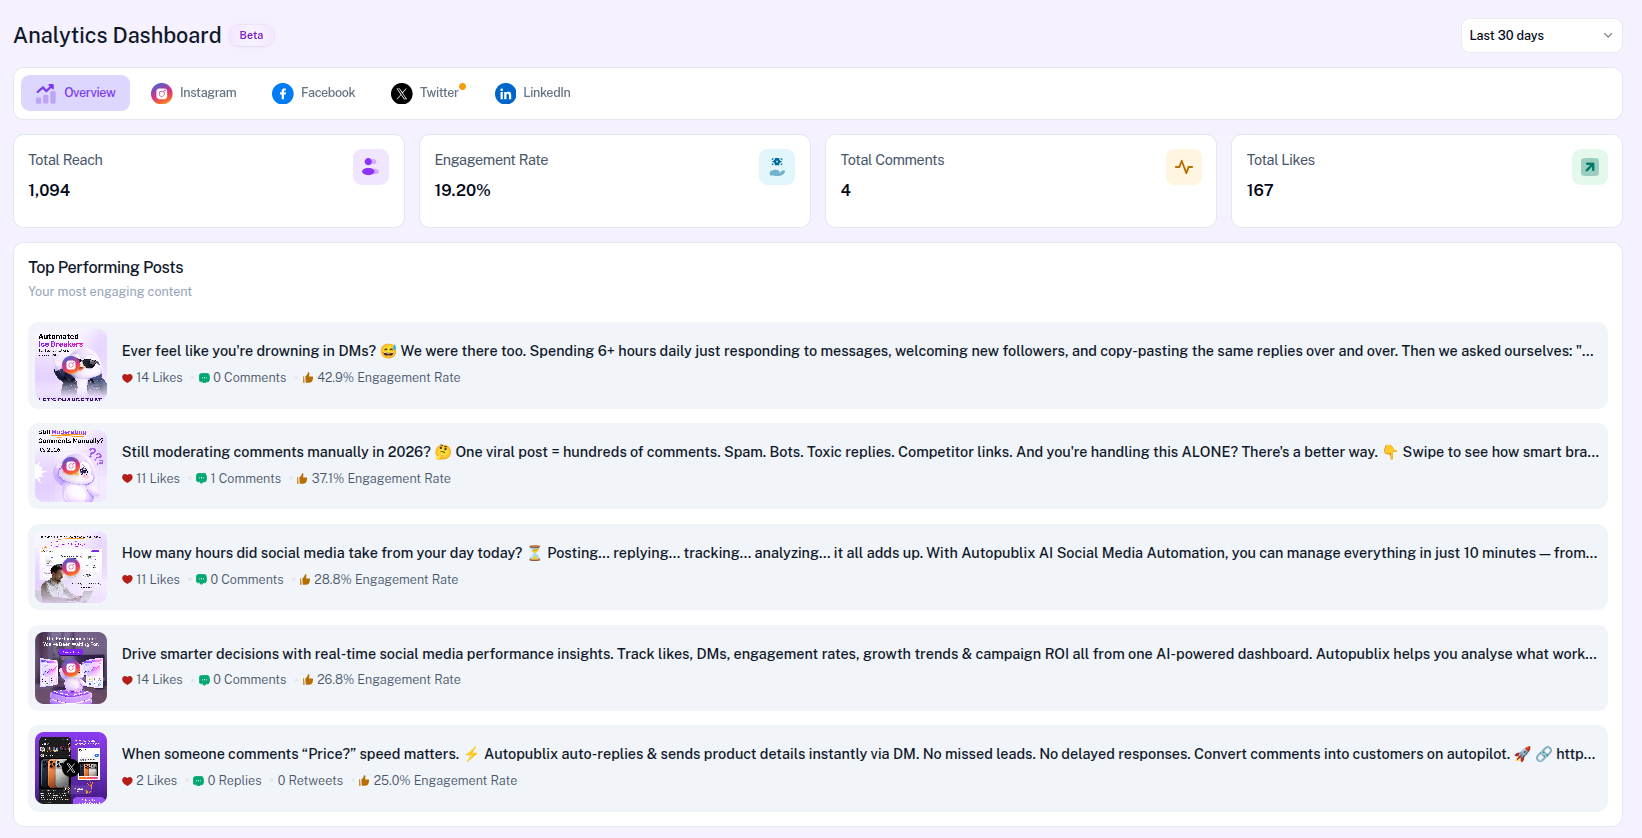
The Analytics Dashboard (marked Beta in the product) shows performance for your connected social accounts — reach, engagement, and top-performing posts. Use the Overview tab for a combined snapshot, then open Instagram, Facebook, or Twitter for platform detail.
To open this page, navigate to:
Navigation: Dashboard → AnalyticsWhat You Can Do on This Page
- Review Overview KPIs across connected platforms
- Filter data by a preset date range (default: Last 30 days)
- Open platform tabs for Instagram, Facebook, or Twitter detail (paid plans)
- Scan Top Performing Posts and open a post from the list
There is no custom date-range picker and no export / CSV download on this page.
Platform Tabs
- Overview — combined reach, engagement, comments, likes, and top posts across connected platforms
- Instagram — platform metrics, engagement cards, top posts, and Content Performance
- Facebook — platform metrics, engagement cards, top posts, and Facebook Insights
- Twitter — platform metrics, engagement cards, and top posts
- LinkedIn — Coming Soon on paid plans (upgrade gate on Free)
On Free plan, platform tabs show Unlock on Creator & Growth plans with an Upgrade Now CTA. In Share My Access (delegated mode), teammates see a contact-the-owner message instead of the upgrade button.
Date Range Filter
Use the selector at the top right (hidden on locked platform tabs and LinkedIn Coming Soon). Options:
- Last 7 days
- Last 30 days (default)
- Last 90 days
- Last 6 months
- Last year
Overview Metrics
The Overview tab shows four summary cards:
- Total Reach — how many users saw your content
- Engagement Rate — interactions relative to reach
- Total Comments — comments across platforms
- Total Likes — likes and Facebook reactions aggregated across platforms
Overview does not show Total Shares. Shares appear on Instagram and Facebook platform tabs.
Platform Metrics
Labels differ by platform:
- Instagram — Total Likes, Total Comments, Total Shares, Total Reach
- Facebook — Total Reactions, Total Comments, Total Shares, Total Reach
- Twitter — Total Impression, Total Likes, Total Retweet, Total Comments (replies)
Engagement Over Time & Platform Performance
On Instagram, Facebook, and Twitter tabs you see two radial cards labeled Engagement Over Time and Platform Performance. Both show an engagement percentage for the selected date range on that platform — they are not a day-by-day time series and do not compare platforms side by side.
These cards do not appear on the Overview tab.
Top Performing Posts
Available on Overview and on Instagram, Facebook, and Twitter tabs. Each entry can include a preview, caption, likes or reactions, comments or replies, optional shares or retweets, engagement rate, and a platform icon. Open a row to view the post in AutoPubliX.
Instagram Content Performance
On the Instagram tab only, Content Performance shows a pie chart of post formats in the selected range (for example Feed and Reels, and other media product types when present).
Facebook Insights
On the Facebook tab only, Facebook Insights charts Reactions, Comments, and Shares for an overview of page performance in the selected range.
Account Connection Warning
If a platform is disconnected, Analytics may still show the latest available data and display a warning. Example:
Reconnect from Settings → Social Connections. In Share My Access mode, the message asks you to contact the account owner to reconnect or upgrade — you do not manage the owner's billing from Analytics.
Instagram may also show an insights-permission banner when the connected account needs additional Instagram insights access.
LinkedIn Analytics (Coming Soon)
On Creator and Growth, the LinkedIn tab shows a Coming Soon placeholder for advanced performance reports, audience growth tracking, and engagement analytics. Free plan users see the platform upgrade gate instead.